
The two main components for portfolio design are data modeling and portfolio optimisation.
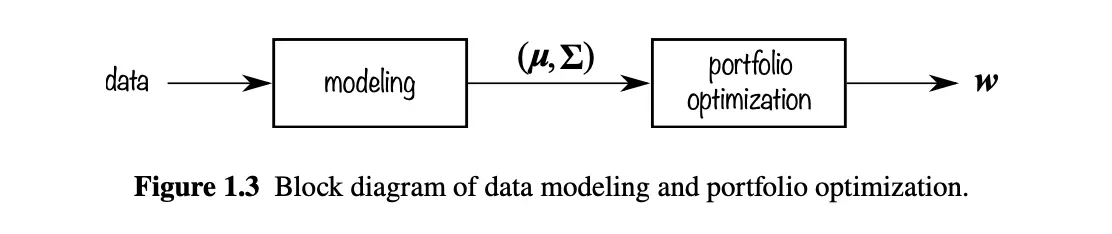
In above figure, the and are bold, meaning that they represent vectors and matrices. Because we are dealing with all stocks at once, we have lists and grids.
- (Mean Vector): Reward list. List of expected returns for every single stock we looking at
- [Apple: +8%, Tesla: +12%, Coca-Cola: +4%, …]
- In academic language, it is called “First-order moment”.
- (Covariance Matrix): The risk and relationship grid. Tells us the risk (volatility) of every individual stock and how every stock moves in relation to every other stock (correlation)
- “Tesla is highly volatile. Coca-Cola is very stable. And by the way, when Tesla goes down, Coca-Cola usually doesn’t care.”
- In academic language, it called “Second-order moment”.
Flowchart is simple:
- Get the data. Like last 20 years of historical prices, inflation rates, interest rates etc.
- We can’t throw raw data directly to optimiser. We use for example forecasting model.
- Model spits out first and second order moment predictions.
- We feed optimisation engine with our moment predictions.
- Engine spits out weights, it is a list of percentages tells us how to spend money.
Resources
Portfolio Optimisation: Theory and Application by Daniel P. Palomar, Page 4.